AMD RX 590 Review – The Card We Don’t Need

Share:
AMD’s CPU division has been on an impressive upswing as of late but their Radeon GPU side has been lagging. What was once the jewel in AMD’s crown effectively hit a solid wall with Vega. Vega was simply too expensive and sported an overly complicated memory interface. But there was some hope that a refined manufacturing process and lower HBM prices could make it a viable contender if a refresh was in the works. Unfortunately, that’s not about to happen.
This situation brings me to today which sees the launch of the AMD Radeon RX 590, a graphics card that’s designed solely with the Christmas shopping season in mind. Basically it’s a way to get the Radeon name back into the news cycle during a key time of the year when a competitor like NVIDIA has a massive (albeit heavily critiqued and pricey) new lineup.
In order to create the RX 590, AMD chose a formula we’ve been living with for more than two years: the Polaris architecture that’s based off a 4th gen GCN design. This architecture has more lives than disco and as you’ll see below the core’s baseline specifications have been around since the RX480 was launched in June of 2016. But what makes this particular iteration a slightly different beast is a move over to TSMC’s 12nm manufacturing process in an effort to gain some efficiency.
And let me tell you, that efficiency was needed since AMD seems hell-bet on pushing that Polaris architecture for all its worth. Whereas the RX 480 had the original spin running at a Boost rate of 1266MHz and the RX 580 pushed that incrementally further, the RX 590 trucks along at an impressive 1545MHz. Even the Base Clock has moved up substantially from 1120MHz back in 2016 to today’s 1469MHz.
While all of the other specifications for these cards have remained the same, the push towards a more competitive performance output causes the RX 590 to consume a pretty insane amount of power. AMD rates total board power at 225W which places it around what an RTX 2080 requires. From my back of napkin calculations, NVIDIA’s RTX 2080 can offer about three times better framerates as well. If that doesn’t give you some idea of how far AMD is behind their competition, I don’t know what does.
Speaking of competition, with a starting price of $279, the RX 590 is meant to duke it out with the GTX 1060 6GB. Given the fact the RX 580 was already doing just that, AMD’s newest card may end up becoming an interesting bridge product between the sub-$300 market and the GTX 1070. That RX 580 will remain around as well since the RX 590’s frequency increases should give it a 10-15% performance boost over its sibling.
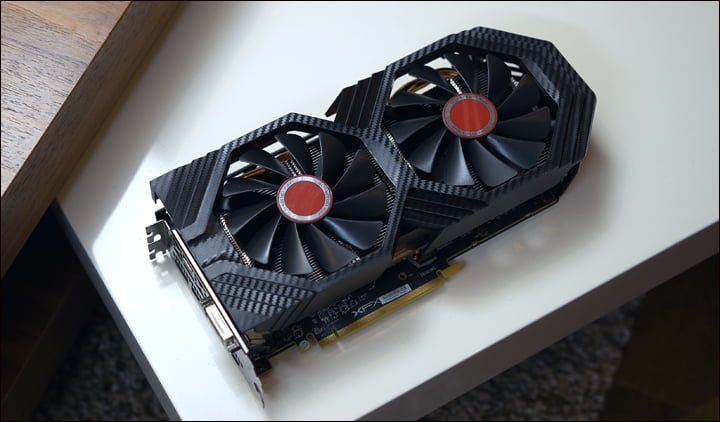
The card AMD sent us is the dubiously-named XFX RX 590 Fatboy. It is actually a pretty good looking card that’s just over 10 ½” long but its portly width and 2.5 slot height hint at how much cooling capacity is required for the overclocked core. XFX also added a modest and completely unnecessary 45MHz “overclock” but that’s what it takes to create an “OC” SKU these days.
One of the talking points AMD seems to be fixated on is the RX 590’s appeal to gamers who are sporting a three to five year old system and want a GPU upgrade. I’m going to challenge that assumption. You see, the RX 590 requires so much power XFX had no choice but to add a 6+8 pin power connectors and its quite likely older systems simply won’t have either the necessary PSU connectors or capacity for such a hungry GPU. Sure, there will be plenty of compatible systems but don’t go buying one of these cards under the assumption it’ll be a simple drop-in upgrade.
While $280 is certainly an appealing price for a relatively high performance 8GB card, AMD is sweetening the pot even further with a game deal. If an RX 590 is bought from a participating retailer, you’ll receive vouchers for three free gaming: Devil May Cry 5, the Resident Evil 2 remake and The Division 2. All of those will be released in the next few months and none are playable immediately, that’s about $180 USD of free software. Naturally, this will only be an added value for those of you who actually want those games but it’s still nice to have.
There’s a reason for this free game offer as well: when taken at face value, the RX 580’s $280 price point isn’t all that competitive given the GPU market’s current state. Much like the challenged NVIDIA faced when launching their RTX cards, AMD’s board partners have been pricing their wares quite aggressively as of late. You can now find an RX 580 for as little as $210 USD and while that doesn’t include any free games it still makes the RX 590 look overpriced.
On paper at least the RX 590 looks like a Hail Mary play in an effort to drum up sales of AMD’s GPUs this holiday season. But let’s find out if this “new” graphics card has a chance against external and internal competition.
Test System & Setup
Processor: Intel i9 7900X @ 4.74GHz
Memory: G.Skill Trident X 32GB @ 3600MHz 16-16-16-35-1T
Motherboard: ASUS X299-E STRIX
Cooling: NH-U14S
SSD: Intel 900P 480GB
Power Supply: Corsair AX1200
Monitor: Dell U2713HM (1440K) / Acer XB280HK (4K)
OS: Windows 10 Pro patched to latest version
Drivers:
NVIDIA 416.81
AMD 18.10 Beta
Notes:
- All games tested have been patched to their latest version
- The OS has had all the latest hotfixes and updates installed
- All scores you see are the averages after 3 benchmark runs
- All IQ settings were adjusted in-game and all GPU control panels were set to use application settings
The Methodology of Frame Testing, Distilled
How do you benchmark an onscreen experience? That question has plagued graphics card evaluations for years. While framerates give an accurate measurement of raw performance , there’s a lot more going on behind the scenes which a basic frames per second measurement by FRAPS or a similar application just can’t show. A good example of this is how “stuttering” can occur but may not be picked up by typical min/max/average benchmarking.
Before we go on, a basic explanation of FRAPS’ frames per second benchmarking method is important. FRAPS determines FPS rates by simply logging and averaging out how many frames are rendered within a single second. The average framerate measurement is taken by dividing the total number of rendered frames by the length of the benchmark being run. For example, if a 60 second sequence is used and the GPU renders 4,000 frames over the course of that time, the average result will be 66.67FPS. The minimum and maximum values meanwhile are simply two data points representing single second intervals which took the longest and shortest amount of time to render. Combining these values together gives an accurate, albeit very narrow snapshot of graphics subsystem performance and it isn’t quite representative of what you’ll actually see on the screen.
FRAPS on the other hand has the capability to log onscreen average framerates for each second of a benchmark sequence, resulting in FPS over time graphs. It does this by simply logging the reported framerate result once per second. However, in real world applications, a single second is actually a long period of time, meaning the human eye can pick up on onscreen deviations much quicker than this method can actually report them. So what can actually happens within each second of time? A whole lot since each second of gameplay time can consist of dozens or even hundreds (if your graphics card is fast enough) of frames. This brings us to frame time testing and where the Frame Time Analysis Tool gets factored into this equation along with OCAT.
Frame times simply represent the length of time (in milliseconds) it takes the graphics card to render and display each individual frame. Measuring the interval between frames allows for a detailed millisecond by millisecond evaluation of frame times rather than averaging things out over a full second. The larger the amount of time, the longer each frame takes to render. This detailed reporting just isn’t possible with standard benchmark methods.
We are using OCAT or FCAT (depending on compatibility) for ALL benchmark results in DX11 and DX12.
Not only does OCAT have the capability to log frame times at various stages throughout the rendering pipeline but it also grants a slightly more detailed look into how certain API and external elements can slow down rendering times.
Since PresentMon and its offshoot OCAT throws out massive amounts of frametime data, we have decided to distill the information down into slightly more easy-to-understand graphs. Within them, we have taken several thousand datapoints (in some cases tens of thousands), converted the frametime milliseconds over the course of each benchmark run to frames per second and then graphed the results. Framerate over time which is then distilled down further into the typical bar graph averages out every data point as its presented.
Understanding the “Lowest 1%” Lines
In the past we had always focused on three performance metrics: performance over time, average framerate and pure minimum framerates. Each of these was processed from the FCAT or OCAT results and distilled down into a basic chart.
Unfortunately, as more tools have come of age we have decided to move away from the “minimum” framerate indication since it is a somewhat deceptive metric. Here is a great example:
In this example, which is a normalized framerate chart whose origin is a 20,000 line log of frame time milliseconds from FCAT, our old “minimum” framerate would have simply picked out the one point or low spike in the chart above and given that as an absolute minimum. Since we gave you context of the entire timeline graph, it was easy to see how that point related to the overall benchmark run.
The problem with that minimum metric was that it was a simple snapshot that didn’t capture how “smooth” a card’s output was perceived. It is easy for a GPU to have a high average framerate while throwing out a ton of interspersed higher latency frames. Those frames can be perceived as judder and while they may not dominate a gaming experience, their presence can seriously detract from your immersion.
In the case above, there are a number of instances where frame times go through the roof, none of which would accurately be captured by our classic Minimum number. However, if you look closely enough, all of the higher frame latency occurs in the upper 1% of the graph. When translated to framerates, that’s the lowest 1% (remember, high frame times = lower frame rate). This can be directly translated to the overall “smoothness” represented in a given game.
So this leads us to our “Lowest 1%” within the graphs. What this represents is an average of all the lowest 1% of results from a given benchmark output. We basically take thousands of lines within each benchmark capture, find the average frame time and then also parse out the lowest 1% of those results as a representation of the worse case frame time or smoothness. These frame time numbers are then converted to actual framerate for the sake of legibility within our charts.
Battlefield 1 Performance
Battlefield 1 has become known as one of the most popular multiplayer games around but it also happens to be one of the best looking titles too. It also happens to be extremely well optimized with even the lowest end cards having the ability to run at high detail levels.
In this benchmark we use a runthough of The Runner level after the dreadnought barrage is complete and you need to storm the beach. This area includes all of the game’s hallmarks in one condensed area with fire, explosions, debris and numerous other elements layered over one another for some spectacular visual effects.
Call of Duty: World War II Performance
The latest iteration in the COD series may not drag out niceties like DX12 or particularly unique playing styles but it nonetheless is a great looking game that has plenty of action and drama, not to mention a great single player storyline.
This benchmark takes place during the campaign’s Liberation storyline wherein we run through a sequence combining various indoor and outdoor elements along with some combat, explosions and set pieces.
Destiny 2
Destiny is a game that continues to evolve to suit online gameplay and new game styles but it has always remained a good looking DX9-based title. For this benchmark we use the single player Riptide mission which combines environmental effects like rain, an open world setting and plenty of scripted combat.
Multiplayer maps may be this game’s most-recognized element but unfortunately performance in those is highly variable.
Far Cry 5 Performance
With a beautiful open world but a day / night cycle that can play havoc with repetitive, accurate benchmarking, Far Cry 5 has a love / hate relationship around here. In this benchmark we use the area around the southwest region’s apple orchards but a basic run-though alongside touching off a small brushfire with explosives.
Forza Motorsport 7 DX12 Performance
Forza 7 is a racing game with a very similar heart to the legendary Gran Turismo series and it looks simply epic. It also happens to use a pretty efficient DX12 implementation. For this benchmark we use the Spa-Francorchamps track along with a full field of competing cars. In addition, the rain effects are turned on to put even more pressure on the GPUs.
Hellblade: Senua’s Sacrifice Performance
Hellblade is a game we wanted to feature here not just because of its amazing graphics and use of the ubiquitous Unreal Engine 4 but also because it’s from a small studio and it deals with mental illness. It’s a great game and you should pick it up.
Our benchmark run begins at the beginning of the Fire Realm section and is a simple walkthrough of the various zones within this level.
Hitman DX12 Performance
The Hitman franchise has been around in one way or another for the better part of a decade and this latest version is arguably the best looking. Adjustable to both DX11 and DX12 APIs, it has a ton of graphics options, some of which are only available under DX12.
For our benchmark we avoid using the in-game benchmark since it doesn’t represent actual in-game situations. Instead the second mission in Paris is used. Here we walk into the mansion, mingle with the crowds and eventually end up within the fashion show area.
Overwatch Performance
Overwatch continues to be one of the most popular games around right now and while it isn’t particularly stressful upon a system’s resources, its Epic setting can provide a decent workout for all but the highest end GPUs. In order to eliminate as much variability as possible, for this benchmark we use a simple “offline” Bot Match so performance isn’t affected by outside factors like ping times and network latency.
Middle Earth – Shadow of War Performance
Much like the original Middle Earth – Shadow of Mordor, the new Shadow of War takes place in a relatively open environment, offering plenty of combat and sweeping vistas. The benchmark run we chose starts on a rooftop in Minas Ithil and gradually runs through the streets and vaulting over buildings. A few explosions are thrown in for good measure too. Due to the ultra high resolution textures, even the best GPUs can be brought below 60FPS here.
Rainbow 6: Siege Performance
Rainbow 6: Siege has been around for a while now but it is continually receiving updates and it remains one of the best co-op multiplayer games on the market. Meanwhile, its UHD Texture Pack allows for some pretty great looking unit models and insures even the best graphics cards are brought to their knees.
As with most online titles, we needed to avoid multiplayer due to the high variability of performance and randomness. Instead, the High Value Target mission in Situations was used.
Warhammer 2: Total War DX12 Performance
Much of this game can be CPU-limited but by increasing in-game details to max, it puts a massive amount of stress on the GPU. Unfortunately, after years in beta, the DX12 implementation is still not all that great.
For this benchmark, we load up a ultra high points multiplayer saved battle between the Empire and Skaven. That means plenty of special effects with Hellfire rockets and warp fire being thrown everywhere. We then go through a set of pans and zooms to replicate gameplay.
Wolfenstien – New Colossus Vulkan Performance
This is the only Vulkan game in this entire review and that’s simply because this API just isn’t used all that much. It never has been. With that said, it has allowed id Tech to create an amazingly detailed world while still offering great overall performance.
For this test the Manhattan level is used so we can combine interior, exterior and preset combat elements into one 60-second run.
Witcher 3 Performance
Other than being one of 2015’s most highly regarded games, The Witcher 3 also happens to be one of the most visually stunning as well. This benchmark sequence has us riding through a town and running through the woods; two elements that will likely take up the vast majority of in-game time.
Analyzing Temperatures & Frequencies Over Time
Modern graphics card designs make use of several advanced hardware and software facing algorithms in an effort to hit an optimal balance between performance, acoustics, voltage, power and heat output. Traditionally this leads to maximized clock speeds within a given set of parameters. Conversely, if one of those last two metrics (those being heat and power consumption) steps into the equation in a negative manner it is quite likely that voltages and resulting core clocks will be reduced to insure the GPU remains within design specifications. We’ve seen this happen quite aggressively on some AMD cards while NVIDIA’s reference cards also tend to fluctuate their frequencies. To be clear, this is a feature by design rather than a problem in most situations.
In many cases clock speeds won’t be touched until the card in question reaches a preset temperature, whereupon the software and onboard hardware will work in tandem to carefully regulate other areas such as fan speeds and voltages to insure maximum frequency output without an overly loud fan. Since this algorithm typically doesn’t kick into full force in the first few minutes of gaming, the “true” performance of many graphics cards won’t be realized through a typical 1-3 minute benchmarking run. Hence why we use a 5-minute warm up period before all of our benchmarks.
With the Polaris core turning into a fire-breathing monster due to AMD’s overclocking, XFX did expand their heatsink design. However, their RX 590 still operates at a higher thermal envelope than the MSI RX 580 card we’re placing it up against.
Luckily it doesn’t look like throttling is entering into this equation but remember we are testing this in an open test bench so your mileage may vary. Personally, I think the current temperatures could lead to an issue within an airflow-restricted environment.
Luckily the XFX card doesn’t bat an eyelash in the framerate either so at least we are getting relatively consistent speeds across the board. Again, I wonder how this would fare without an open test bench.
Acoustical Testing
What you see below are the baseline idle dB(A) results attained for a relatively quiet open-case system (specs are in the Methodology section) sans GPU along with the attained results for each individual card in idle and load scenarios. The meter we use has been calibrated and is placed at seated ear-level exactly 12” away from the GPU’s fan. For the load scenarios, Hellblade: Senua’s Sacrifice at 4K is used in order to generate a constant load on the GPU(s) over the course of 10 minutes.
And while the acoustics for the XFX Fatboy seem to be high based on the other whisper-quiet options in this lineup, it is actually extremely quiet. The fan speeds remained a muted hum throughout testing and there wasn’t any apparent coil whine. With that being said, it is more than obvious AMD’s board partners are at the very limits of their cooling design and any push in one direction or another could push the card’s acoustics over the edge.
System Power Consumption
For this test we hooked up our power supply to a UPM power meter that will log the power consumption of the whole system twice every second. In order to stress the GPU as much as possible we used 10 minutes of Hellblade: Senua’s Sacrifice running static while letting the card sit at a stable Windows desktop for 15 minutes to determine the peak idle power consumption.
This is one area we were quite concerned about and with good reason it seems. The amount of power required by the RX 590 is biblical. It requires a good 100W more than the GTX 1060 6GB and substantially more than the RX 580 and GTX 1070.
AMD is really pushing things with this core and judging from these numbers its been moved well beyond its initial design specs. Just to put this into perspective, the RX 590 delivers one third the performance of an RTX 2080 but consumes about the same amount of juice.
Conclusion – The Card AMD Needed But We Didn’t?
This is going to be a bit of a tough conclusion since I’m really torn about the RX 590 and its place within AMD’s current lineup. This is a obviously a card solely being launched to generate interest in a flagging product stack and if anything it shines a bright light upon AMD’s struggles to remain competitive in the graphics market. Personally I’m hoping this is just a placeholder until something more appropriate is launched in 2019 but that may end up being nothing more than a pipe dream.
From a raw performance standpoint, the RX 590 obviously strikes a winning combination against NVIDIA’s GTX 1060 6GB. Whereas the GTX 1060 is pretty much a one-trick pony that excels at 1080P gaming but tends to lag at 1440P, the RX 590 can easily pull double duty. That’s good news if you are currently gaming at 1080P and plan on upgrading to a higher resolution display sometime down the line.
Where things get kind of murky is the RX 580 vs RX 590 question. On one hand the RX 590 easily hits AMD’s estimated 10-15% performance increase at 1080P and while that gap does narrow at 1440P, the new card still easily maintains its lead. The problem really boils down to price. With RX 580’s currently sitting at $210 to $225 for some great AIB cards, the RX 590 isn’t a particularly good value right now. Sure you get those free games but I can’t really take those into account.
Perhaps the largest challenge facing AMD right now is their chosen core architecture either has issues scaling towards less complex products (Vega) or its been pushed close to its breaking point (Polaris). The RX 590 falls into the latter category since its power consumption numbers are astronomical in comparison to its relative performance.
Pushing frequencies results in diminishing returns as an architecture is yanked past its originally design specs and we’re seeing this here. This is one power hungry GPU and that might cause issues for would-be upgraders. Not only that but with power rates increasing all the time, that 100W increase versus the GTX 1060 6GB may not seem like much at first but it will cost you money over time.
All in all I think the RX 590 offers truly impressive performance for its price but there are some very serious trade-offs as well. If you have the money and the PSU capacity then the XFX RX 590 Fatboy could be a good fit but I’d look very seriously at the RX 580’s price before taking the plunge. Let’s all hope that AMD has something more interesting for us next year.